Highlights:
- 66 per cent of Indian Americans favor the Democratic Senate candidate.
- 86 per cent say cost of living is very or extremely important.
- 66 per cent cite health care as a major household expense.
- 63 per cent support reducing ICE funding.
- 40 per cent say Democrats have not contacted them in the past year.
INDIAN AMERICAN voters are heading into the 2026 midterms with strong Democratic leanings and growing concern over the cost of living, according to a new survey.
The 2026 Asian American and Pacific Islander (AAPI) Voter Survey, released on August 26 by Asian and Pacific Islander American Vote (APIAVote) and AAPI Data, offers a snapshot of voter sentiment ahead of the November elections.
The survey, the latest in a biennial series tracking the AAPI electorate, was released as both parties sharpen their pitches ahead of a midterm cycle expected to hinge on affordability.
Ninety-two percent of Asian Indian respondents said they plan to vote in November, with 74 per cent absolutely certain and 23 percent fairly certain. Sixty-six per cent said they would back the Democratic candidate if the Senate election were held today, compared with 22 per cent for the Republican candidate, 7 percent for another party and 3 per cent undecided.
The House figures were similar, with 66 per cent backing the Democratic candidate and 18 per cent the Republican. The figures reflect sentiment at the time of the survey and could shift as campaigning intensifies.
Party preference tells only part of the story. Cost of living and inflation topped voters’ concerns, with 86 per cent of Asian Indian respondents calling the issue very or extremely important to their vote — 39 per cent very important and 47 per cent extremely important, the highest intensity of any issue tested. Social Security and Medicare followed at 78 per cent, foreign policy at 76 percent, health care at 75 per cent, public safety at 74 percent and education at 72 percent.
 Indian Americans recorded the highest Democratic support among the Asian ethnic groups surveyedGetty Images
Immigration ranked lower but still significant, at 63 per cent.
Sixty-eight per cent cited racism, discrimination and hate crimes, and 53 per cent cited abortion and reproductive rights.
Those worries track with what respondents said they are struggling to afford. Sixty-six per cent named health care among the hardest expenses for their family — the single most commonly cited burden — followed by housing or rent, named by half of respondents. Food and groceries were flagged by 44 per cent, education by a quarter, and childcare by a fifth. Taken together, the affordability data suggest the anxiety over cost of living is not abstract: it maps directly onto specific, recurring household expenses.
On which party is better suited to handle these issues, Democrats led comfortably across the board. Forty-five per cent of Asian Indian respondents said Democrats were doing a better job on cost of living, against 16 per cent for Republicans, with 35 per cent seeing no difference. The Democratic advantage widened on health care (56 per cent to 13), education (54 to 13) and Social Security and Medicare (56 to 12), and was smaller but still clear on foreign policy (49 to 11) and immigration (49 to 22). The one issue where the parties ran closer was crime and public safety, where 44 per cent favored Democrats, 21 per cent Republicans and 32 per cent saw no difference.
 Christine Chenx
On enforcement specifically, 63 per cent of Asian Indian respondents said Congress should drastically reduce funding for Immigration and Customs Enforcement — 40 per cent strongly agreeing and 23 per cent somewhat agreeing — while 21 per cent were neutral and 14 per cent disagreed. A far broader majority, 80 per cent, said enforcement agents should be required to wear body cameras, with 63 per cent strongly in favor.
The Democratic tilt is more pronounced among Indian Americans than in most other Asian ethnic groups the survey measured. Senate support for Democrats among the Asian ethnic groups surveyed ranged from 42 per cent among Filipino respondents to 66 per cent among Indian Americans, putting Indian Americans at the top of the range. Filipino respondents were the only group in which Republican support, at 49 per cent, exceeded Democratic support. Across Asian American voters overall, 60 per cent favored the Democratic Senate candidate and 24 per cent the Republican; in the House race, it was 64 per cent to 22 per cent — figures that put Indian American Democratic support well above the Asian American average in both races. Pacific Islander voters, whom AAPI Data tracks separately, leaned Democratic by a narrower margin.
Despite that lean, most Indian American voters say neither party has done much to reach them. Forty per cent reported no contact at all from Democrats in the past year, while 44 per cent said they had gotten some or a great deal of outreach and 15 per cent a little. Republicans fared worse: 56 per cent of respondents reported no contact whatsoever, with only 9 per cent describing a great deal. Forty per cent also said community organizations had not reached out. Across the full AAPI electorate, the pattern held — 42 per cent reported no Democratic contact and 58 per cent no Republican contact.
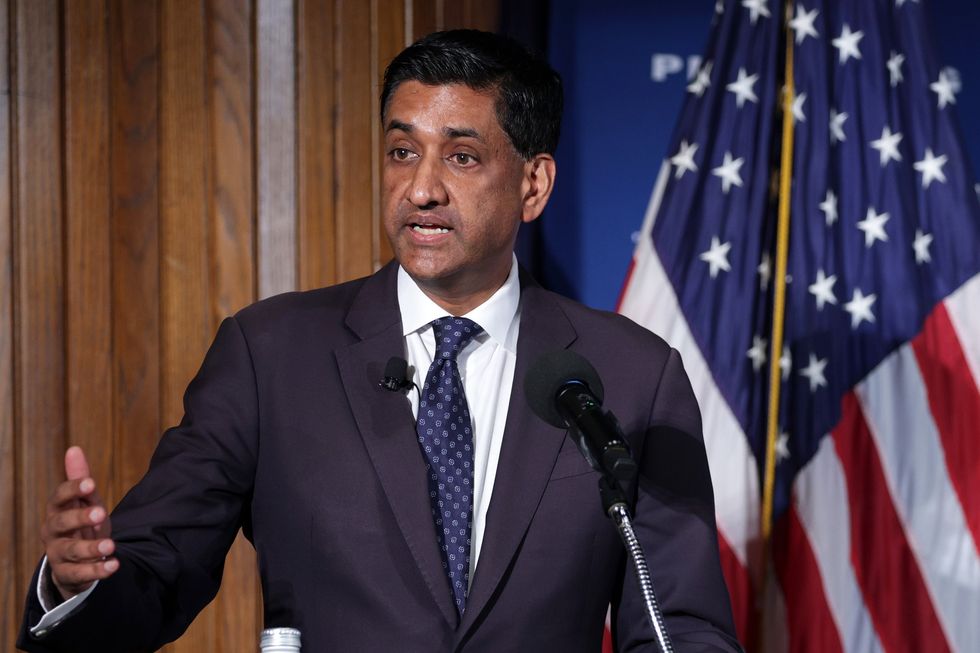 Democratic congressman Ro KhannaGetty Images
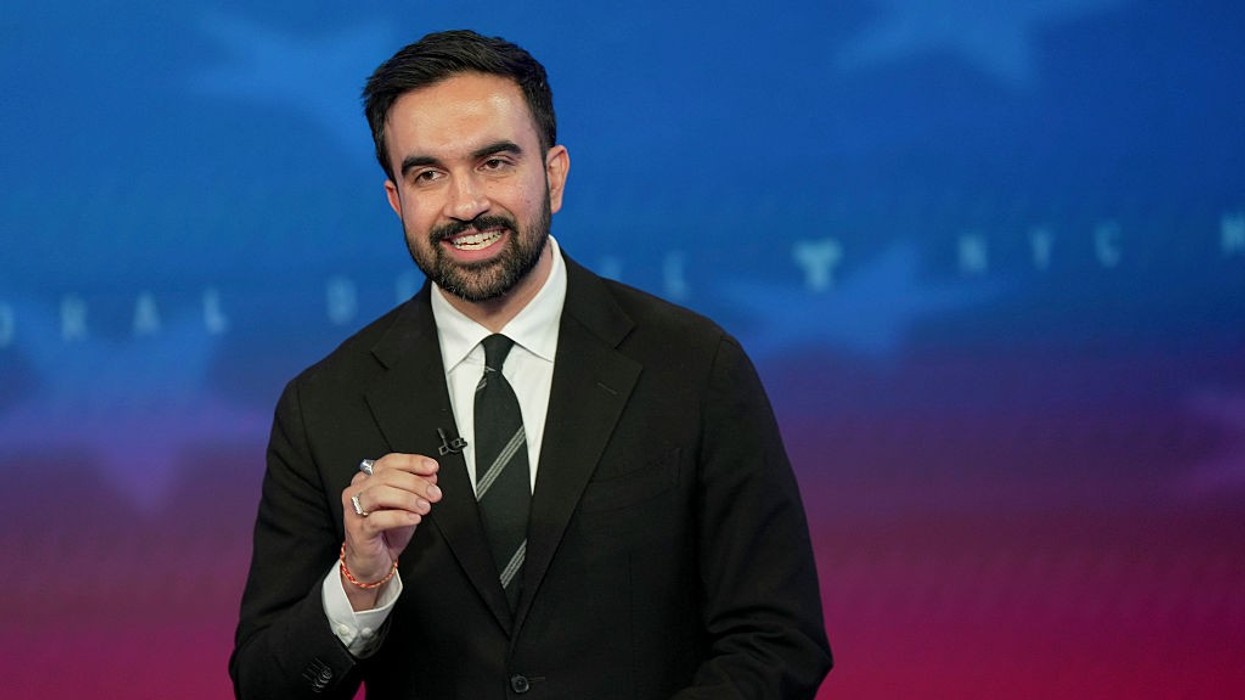
“With Asian Americans being the fastest-growing electorate in the country, it’s crucial that we have the latest data on what motivates them to turn out and vote,” said Karthick Ramakrishnan, founder and executive director of AAPI Data. “Our data show that many AAPI voters still haven’t been contacted by either party, signaling that there is tremendous electoral potential waiting to be activated.”
That gap in outreach hasn’t stopped voters from engaging on their own. Three-quarters of Indian American respondents said they had discussed politics with family or friends in the past year, a quarter had done so on group messaging apps such as WhatsApp, WeChat, KakaoTalk or LINE, and nearly as many had posted about politics on social media. Smaller shares had donated to a campaign (14 per cent), contacted an elected official (18 per cent) or attended a local government meeting such as a city council or school board session (20 per cent).
At the same time, two-thirds said they always or often feel exhausted thinking about politics, and just 13 per cent said they rarely or never do. Still, 43 per cent described themselves as more enthusiastic about voting this year than usual, compared with 22 per cent who said they were less enthusiastic and 32 per cent who felt about the same — slightly higher than the 37 per cent of Asian American voters overall who reported feeling more enthusiastic this cycle.
Television remains the top news source for Indian American voters, at 46 per cent, followed by newspapers and their websites at 37 per cent, YouTube at 34 per cent, Facebook at 28 per cent, and X and WhatsApp at 16 per cent each. Across the broader AAPI electorate, family and friends remain the most trusted source of political information, at 62 per cent, ahead of academic experts at 60 per cent, community journalists at 50 per cent and AAPI-serving organizations at 47 per cent.
The stakes of that outreach gap are growing. AAPI Data estimates 16 million AAPI voters will be eligible in 2026, 1.6 million more than in 2022. The group accounted for 12 per cent of the eligible electorate in Nevada, 4.4 per cent in Arizona, 4.2 per cent in Georgia, 3.3 per cent in Pennsylvania, and 3 per cent each in Michigan, North Carolina and Wisconsin in 2024 — margins that could matter in close congressional races.
Turnout intent across the full AAPI electorate also climbed to 90 per cent this cycle, up from 84 per cent in 2022 and 86 per cent in 2018, with 71 per cent absolutely certain they will vote.
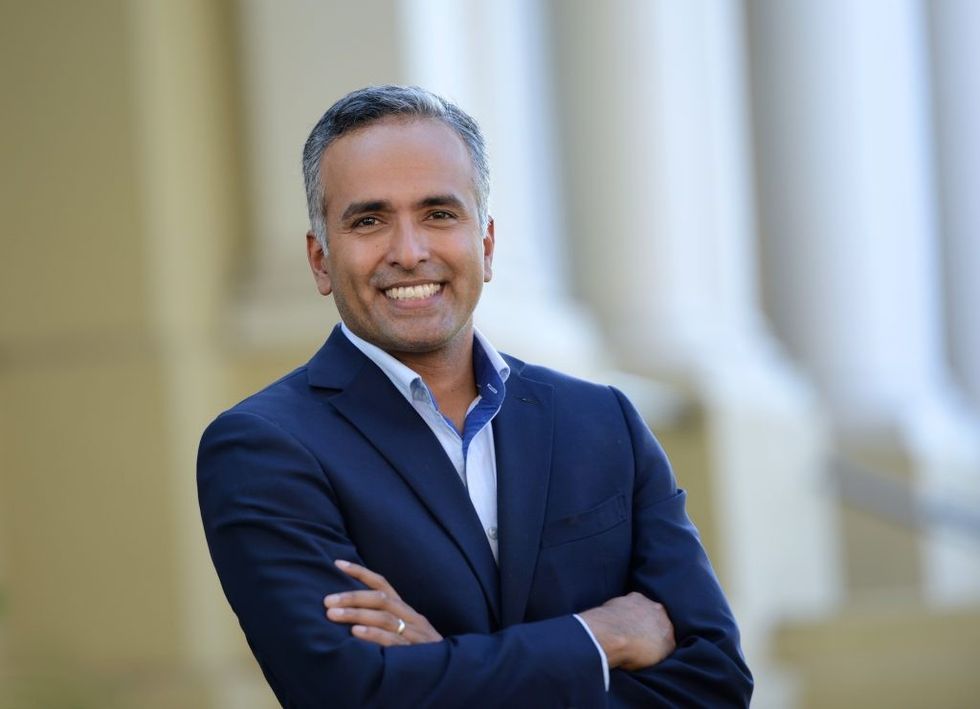 Karthick Ramakrishnanx
“For the last 14 years, APIAVote and our local partners have organized and mobilized AAPI communities across the country, helping drive continued increases in voter participation election after election,” said Christine Chen, the organization’s founder and executive director.
“This year we are seeing even more voters planning to cast their ballots for the midterms. Together, we are committed to keeping that momentum going by reaching voters with trusted, in-language information and making sure they can safely and properly cast their ballots and have their votes counted.” The survey polled roughly 2,066 AAPI voters — 1,896 Asian Americans and 170 Pacific Islanders — between June 3 and July 27, before the final stretch of the campaign, using phone, MMS-to-web and online recruitment. Researchers applied ethnicity quotas and weighted results to known voter characteristics, and tested for nonresponse bias.
The picture that emerges is of a bloc that is highly likely to vote, currently favors Democrats by a wide margin, and remains largely untouched by either party’s ground game. The survey does not say which issue will ultimately decide votes in November. But for now, the cost of living, more than any other concern, is shaping how Indian American voters see the choice ahead.