
- 66 per cent of Asian Indian voters favor Democratic Senate candidates
- Asian voters favor Democrats 56 per cent to 21 per cent for the House
- Indian American Democratic identification has fallen to 46 per cent
- Independents now make up 29 per cent of Indian Americans
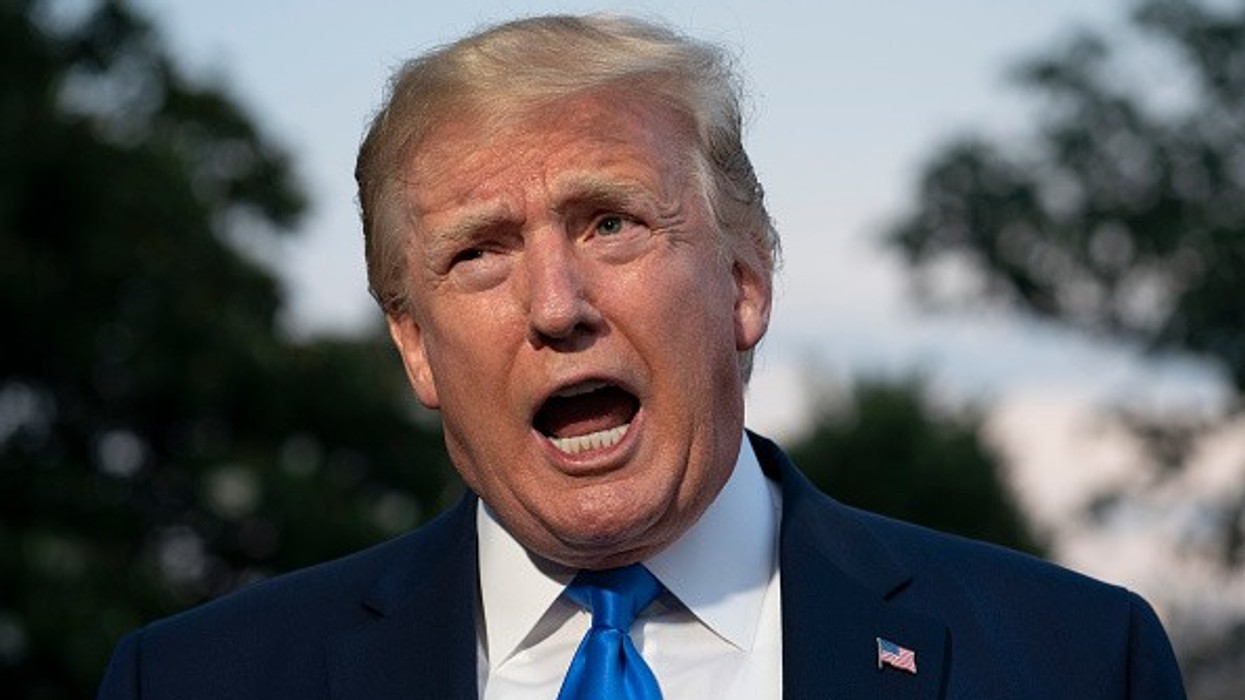
- Trump’s overall approval stands at 32 per cent
The latest data suggest that Indian American politics in 2026 is more complicated than a simple return to the Democratic Party.
AAPI Data’s 2026 voter survey finds that 66 per cent of Asian Indian voters favor the Democratic candidate for Senate, while the Republican share is not provided in the headline finding. Across Asian American voters as a whole, Pew Research Center found Democratic candidates leading Republican candidates 56 per cent to 21 per cent in preferences for the US House. Pew’s survey was conducted among registered voters from July 6-12, 2026, and its Asian estimate represents English-speaking Asian adults.
The numbers come after a notable Republican gain among Asian voters in 2024. Pew’s analysis of validated voters found that 57% of Asian voters backed Kamala Harris and 40 per cent backed Donald Trump, compared with a 70%-30% split for Joe Biden and Trump in 2020. Pew says much of the change reflected differences in turnout, with relatively fewer voters switching parties than the overall numbers might suggest.
Among Indian Americans specifically, Carnegie’s 2024 Indian American Attitudes Survey found that 61 per cent of registered voters intended to vote for Harris and 31 per cent for Trump, compared with 72 per cent for Biden and 22 per cent for Trump in its 2020 survey. The survey therefore recorded a shift toward Trump, but not a majority of Indian Americans moving to the Republican candidate.
More independents, weaker party attachment
The more striking change may be happening outside the two major parties.
Carnegie’s 2026 Indian American Attitudes Survey found that the share identifying as Democrats had declined from 52 per cent in 2020 to 46 per cent in 2026. Republican identification rose from 15 per cent to 19 per cent, while the independent share climbed to 29 per cent, up from 25 per cent in 2024 and 23 per cent in 2020.
That makes the phrase “losing the Desi vote” difficult to apply as a single explanation. The data point to weaker Democratic identification alongside a smaller but larger-than-before Republican constituency and a growing independent group.
Immigration is one of the biggest pressure points
Trump's immigration policies are particularly relevant to Indian Americans because of the community's connection to employment-based immigration.
The Trump administration has extended its $100,000 fee on certain new H-1B petitions for workers outside the United States through September 21, 2027. The White House says the policy is intended to discourage lower-wage and lower-skilled recruitment and prioritize higher-skilled, higher-paid workers. Indian nationals are heavily represented among H-1B workers affected by the system.
Carnegie's 2026 survey found that 64 per cent of Indian Americans disapprove of Trump's immigration policy. It also found majorities opposing several immigration measures, including the deportation of immigrants to third countries.
The economy may matter more than party labels
AAPI Data's 2026 survey shows that economic issues are central to Asian American voters. Cost of living and inflation was identified as very or extremely important by 90% of respondents, followed by healthcare at 82 per cent and jobs and unemployment at 80%. Education, public safety, foreign policy, racism and immigration also rank prominently.
That fits with broader national polling. A September Reuters/Ipsos survey found Trump's approval at 32 per cent, while registered voters preferred Democratic congressional candidates over Republicans by 43 per cent to 35 per cent, an eight-point Democratic advantage. The poll also found only 17 per cent approving of Trump's handling of cost-of-living issues.
So, what does it mean for 2026?
The available evidence does not show a single political direction for Indian Americans.
Trump made gains among Asian voters in 2024, while Indian Americans also showed some movement toward Republicans. Since then, however, surveys have found lower approval of Trump among Indian Americans, continued Democratic identification, and a growing independent bloc.
Carnegie's 2026 survey found 29 per cent approval and 71 per cent disapproval of Trump's job performance among Indian Americans. At the same time, the Democratic Party's own favorability has also fallen, from 60 in 2024 to 53 in 2026.
The emerging picture is therefore less about one community moving neatly from one party to another and more about Indian American voters weighing immigration, the economy, education, healthcare, foreign policy and identity while showing weaker attachment to either major party.